
This is Part 2 of a post on reflective data analysis and responsive teaching tools. See the first post here.
For those whom I have not yet had the privilege to work with, my name is Brandon Owashi and I am the Director of Institutional Research at Riverside City College. I am amazed by the content that you have put together and am honored to participate.
In today’s world, it seems like everything revolves around data, and I am sure you are tired of hearing about it. The technology and business industries have always relied heavily on data, but in recent years data analytics has even expanded into sports. In higher education, you are expected to know and understand data about your institution without ever being taught how to interpret it, or told why it is important. Think back to when you first started teaching in higher education—did anyone explain what fill rates represent and why the college cares about them? Or how about the dizzying number of data acronyms that fill our committee discussions? It can definitely be overwhelming and intimidating, and I am working towards making it a little more digestible. Here are some of the things that the Office of Institutional Effectiveness is implementing to achieve that goal.
Why does data matter?
Throughout the years at RCC, student success has followed a consistent pattern. Certain student groups experience high success while others are much less successful. While this occurs across different groups, it is quite evident across race/ethnicity groups.
Figure 1. The RCC course success rates disaggregated by race/ethnicity from the 2015-16 to 2019-20 academic years. Grades of EW are counted as unsuccessful in Spring 2020.
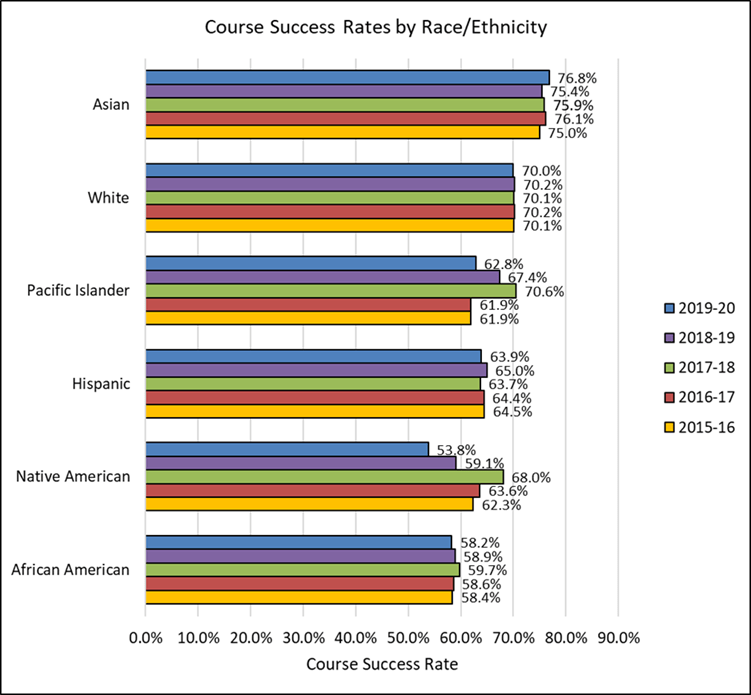
As you can see from the above figure (Figure 1), there are clear differences in course success rates across race and ethnicity groups. While Asian and White students tend to have higher success rates, our historically-minoritized groups have, on average, experienced less success. This is considered an equity gap, which is defined by Higher Learning Advocates as “a significant and persistent disparity in educational attainment between different groups of students.” Similar equity gaps are seen in other success metrics such as award rate and transfer rate. Without regular data analysis and observation, these equity gaps may go unnoticed. Data observation helps us identify strengths and weaknesses, while also allowing us to measure the impact of the changes we make at RCC. Overall, data provides a platform to monitor our progress towards achieving our goals.
Data Coaching
Data Coaching is a program designed to increase the number of individuals trained to facilitate conversations about student equity data. Whether it be during the various meetings around campus, or informal one-on-one conversations, data coaches can help simplify the data, identify trends, and explain the importance behind the findings. Data Coaching is relatively new in the California Community College system but has been gaining traction in recent years due to the success of the programs at Santa Monica College and Bakersfield College. While most programs focus on broadly increasing data literacy and capacity at the college, we created a Data Coaching program that is narrowly focused on student equity data. With help from Santa Monica College and Reedley College (“Data Literacy Certificate” in the Canvas Commons) we were able to launch our Data Coaching program in Fall 2020. The data coaches were selected across most divisions and includes Classified Professionals, Faculty, and Administrators. Each data coach has gone through training and has obtained skills to facilitate conversations surrounding student equity data.
Data Coaches:
- Ajene Wilcoxson (Business)
- Ellen Brown-Drinkwater (Counseling)
- Gloria Aguilar (LHSS)
- Ismael Davila (Student Services)
- Jo Scott-Coe (English)
- Paul Richardson (Chemistry)
- Oliver Thompson (Criminal Justice)
- Tammy Vant Hul (Nursing)
Power BI
Power BI is a Microsoft data visualization software that enables us to create interactive dashboards. The District Office has recently purchased Power BI Premium, so in the near future all RCCD employees will have access to a number of Power BI dashboards through Office 365. Our Power BI dashboards are designed to be user-friendly and easily digestible so that data will not only be more readily available, but also easier to understand. The data coaches are familiar with the student equity dashboard, which currently looks at course success rates disaggregated by race/ethnicity, and will be able to help navigate conversation surrounding those data. While the data coaches will only have access to high level data, if you would like to see your individual course success data, please send me an email (brandon.owashi@rcc.edu).
Moving Forward
As we continue our journey to becoming an even more data-driven institution, just know that you are not on your own. The Office of Institutional Effectiveness is here to help and additional resources are on their way. We are currently in a unique position where we have the opportunity to be the first generation in higher education to tackle student equity, start to close equity gaps, and support student groups that have been disproportionately impacted for generations. I hope this has helped pique your interest in observing data at RCC! Should you have any questions or want to learn about how you can get more involved, please do not hesitate to contact me.
