
by Kirsten Gerdes
During my second year at RCC, I ran into a student on campus I’d had my first year. He asked whether I was offering the class again he’d had with me the previous year since he’d failed the course. After confirming that I was offering the class again the next semester, he commented, “I really enjoyed your class and was surprised when I realized I wasn’t gonna pass simply because I’d missed some of the weekly assignments.” This was a student who’d done well on the midterm and had been an active participant in class discussion, but lost motivation post-midterm when he saw the impact of his missing assignments that had left him with a non-passing grade. In the year after I had him in class, I changed my grading schema to minimum grading—and had I employed this system when he was my student, he would’ve passed my class initially.
Among things considered sacred cows to teachers, grading practices seems to rank high on the list. In Chapter 1 of Grading for Equity, Joe Feldman links teachers’ grading practices with their sense of identity:
Because each teacher’s grading system is virtually unregulated and unconstrained, a teacher’s grading policies and practices reveal how she defines and envisions her relationship to students, what she predicts best prepares them for success, her beliefs about students, and her self-concept as a teacher. That’s why challenges to our grading practices don’t just offend our professional judgment; they can invoke an emotional and psychological threat.
(Feldman 6)
It isn’t surprising that in a system like the American academy, which has played education like a zero-sum game of funding and prestige, faculty believe their grading practices reflect both the difficulty of the subject matter and their own rigor. This is compounded by the ways the white supremacist capitalist patriarchy has shaped this system that has helped shape us as educators. However, Feldman’s challenge to teachers to reflect on the purpose and effectiveness of grades actually leads to greater rigor and accuracy. Central to this discussion is the pushback against giving zeros for non-completion of work.
Minimum grading is not ‘credit for nothing’
I was first introduced to the concept of minimum grading by my partner, who was working as a high school math educator at the time in a school district that used minimum grading, a system in which the lowest grade entered in the gradebook must be 50%. I distinctly remember that before he’d even finished explaining how he wasn’t allowed to enter anything lower than 50%, I cut him off to exclaim, “But that’s not fair! It’s giving credit to people for doing nothing!” This is perhaps the most common response from those who, like me, had only ever known, used, and been assessed by a conventional grading system.
In the intervening years since I was first introduced to this concept, I read more and had lengthy discussions with my partner (who now works on math curriculum in a district K-12 office) about how to structure my grading schema to both accurately reflect students’ acquisition of learning outcomes and to efficiently streamline my process for grading. Initially, I transitioned to minimum grading, but in the last year have moved away from using the 100-point scale almost entirely.
So why is giving a zero for non-completion so inequitable?
I think the answer is twofold. Let’s start with the math of it: while GPAs are calculated on a 4-point scale corresponding to letter grades, most course grades are calculated as a percentage on a 100-point scale corresponding to letter grades. This necessitates a conversion of percentage to grade point, but the ratio represented between each letter grade in the grade point system is not equal to the ratio between each letter grade in the percentage-based system. As a result, the conversion process disproportionately weights the F for non-completion (i.e., the zero) compared to every other letter grade.
Consequently, a student who misses an assignment and receives a zero in the conventional percentage-based system has not earned a zero on the grade point scale; mathematically, it is more like they landed on -6.0 in the 4-point GPA scale.[1] [The 1.0 difference between 4.0 and 3.0 translates to 10 percentage points between A and B in the conventional system; if the difference between A and F in the conventional system is 100 percentage points, then on the GPA scale, the F would translate to 10.0 points away from 4.0, or -6.0.] Minimum grading, on the other hand, issues 50% as the failing grade, which puts it at the same relative distance to a D as a D is to a C, a C is to a B, and so on.
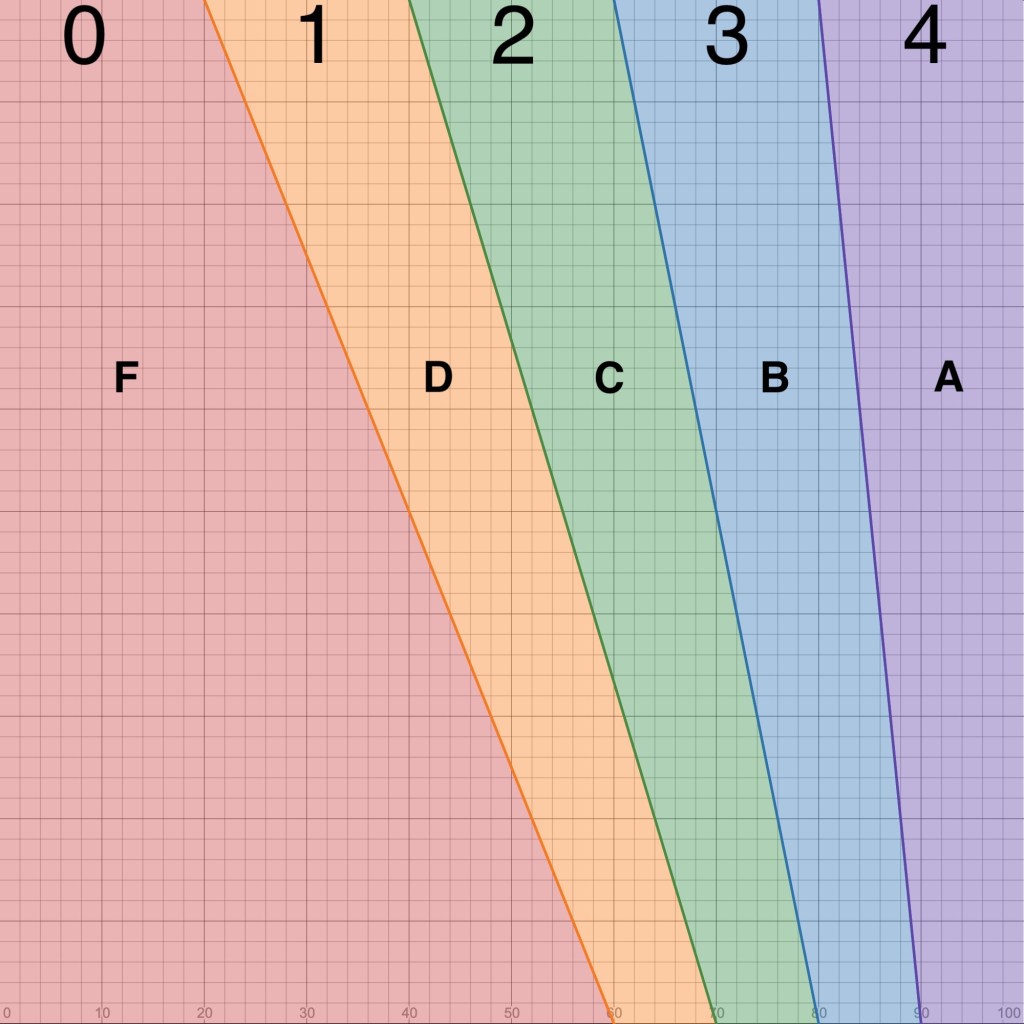
Take a look at this graph that shows how disproportionately weighted the F is compared to the other letter grades in a conventional system. The GPA scale is written across the top of the graph with the corresponding percentage point range across the bottom (where each 5×5 square is 10 percentage points). The F area of the graph is the largest, and earning a zero (on the far left of the graph) puts you at a greater distance to the next grade up than at any other grade in the graph:
To demonstrate how (unintuitively) detrimental a zero is to the student’s grade, let me give a very simple example. Rosie is a student in your class in which there are 11 assignments total, and for which you grade using the 100-point conventional grading scale on each assignment. She receives a 95 and a 95 on the first two assignments but misses the third assignment. Her average is now 190/300 = 63% (D). If she receives 100 on the next eight assignments, she’s brought her average up to an A, but if she scores below a 100 on any assignment, she remains below an A despite earning a high A on 10 out of 11 assignments.
This scenario raises a couple initial questions here. First, how many near-perfect As does it take to bounce back from a zero in the conventional system? In Rosie’s case, it took eight perfect 100s to earn an A after just one zero. Second, if someone doesn’t score the number of near-perfect As needed to earn an A average after just one zero, does the lower grade accurately reflect her level of proficiency on student learning outcomes? In contrast, minimum grading accurately translates the ratio of the 4-point grading scale into the percentage-based grading scale by eliminating the disproportionate weight on zeros compared to every other grade earned. In Rosie’s example, her average after three assignments would’ve been 80% (95+95+50/300), and it would’ve taken half the number of As to raise her average to an A.
Once we consider the mathematical reason the zero is inequitable, the second reason becomes obvious. The students most affected by this disproportionate grading scale are those who are already disadvantaged: students whose work schedules shift, or whose caretaking responsibilities suddenly change, or who don’t have easy access to the technology needed to complete assignments, or whose neurodiversity is unmanaged due to poor access to affordable mental healthcare, or whose housing situation is unstable. Seeing the distance one must cover to make up for one zero does not foster motivation in that student. Feldman writes, “There’s no research that finds that failing grades motivate students, and plenty of research that has found the opposite—that a student who receives 0s and Fs becomes less motivated, not more motivated” (76). So not only does the zero not make mathematical sense, but it does not have the effect on our most vulnerable students that we want grades to have.
Alternatives to minimum grading
Once I implemented minimum grading, I saw a significant change in student success among those who’d have failed under the conventional grading system I’d used in the past. In the past year, I’ve been experimenting with translating the 4.0 GPA scale to an equitable distribution across a 100-percentage-point scale, attempting to assess each assignment on a 4-3-2-1-0 scale. Thus, I do give out zeros, but there are an equal number of percentage points between each letter grade from 0 to 100. (E.g., this makes 50% in my system a C.)
There are other options that emerge once we seriously reflect on what we see as the purpose of grades. If they’re meant as markers of a student’s proficiency or mastery of student learning outcomes, Feldman suggests that averaging a student’s performances may not accurately reflect the level of proficiency gained over the course through the student’s work. Weaker performance at the beginning of a course reflects the student’s relative privilege in preparedness for the course; averaging their performance over time codifies that privilege into a grade. A more equitable method would be to weight the most recent assignment(s) in the final grade to more accurately reflect the student’s knowledge and mastery of learning outcomes.[2]
One final alternative to minimum grading that I’ll briefly pose is specifications (“specs”) grading, in which the professor creates “bundles” of assignments that outline the minimum work needed to earn the letter grade the student wants. Each assignment must meet all requirements set out by the professor in order to receive credit, so each assignment is graded as P/NP. While this requires both significant and timely feedback to students, and careful and thoughtful preparation in creating each grade’s bundle, it likewise empowers students to work toward the grade they want and motivates them to meet the standards of each assignment in order to receive credit.[3]
The journey to equity in grading must include thoughtful and honest reflection on what grades are supposed to communicate, why we have chosen our particular grading methods, and whether we find these methods effective at fulfilling the purpose of grades in the first place. It is from this place of active self-reflection that we can hopefully begin to envision new tools to use in our efforts to eradicate inequity in our teaching.
Works Cited
Feldman, Joe. Grading for Equity: What It Is, Why It Matters, and How It Can Transform Schools and Classrooms. Thousand Oaks, CA: Corwin, 2019.
Nilson, Linda B. Specifications Grading: Restoring Rigor, Motivating Students, and Saving Faculty Time. Sterling, VA: Stylus Publishing, 2015.
Reeves, Douglas. “The Case Against the Zero.” Phi Delta Kappan,vol. 86, no. 4, 2004, pp. 324-325.
[1] For more discussion on the math of the zero, see Douglas Reeves, “The Case Against the Zero.”
[2] For a more detailed discussion of this, see Feldman p. 97-99.
[3] For more on specs grading, see Linda B. Nilson’s Specifications Grading: Restoring Rigor, Motivating Students, and Saving Faculty Time.

Thank you for the visuals and careful explanations. I’ve always struggled with the concept of “weighting” more because I find the calculations confusing, whereas the 100-point scale has always seemed transparent and easy-to-understand. However, I can see how the 0 “F” weighs heavily. I’m curious, from a practical standpoint, how one can use the gradebook set up in Canvas and how to communicate the grading system to students. I’d love to see examples!
LikeLike
Before I respond to your question, I just want to affirm that Feldman speaks directly to the sentiment you mention about the 100-point scale being easy and transparent–you are definitely not the only educator who’s chosen the 100-point scale for those reasons. Chapter 7 of Feldman’s book offers a good discussion about accuracy in relation to how grades are calculated, if you’re interested in a more in-depth explanation.
In relation to Canvas, our options are somewhat limited. Here are two options (I do the second):
1. Make sure the “Enable Course Grading Scheme” is _not_ checked. If it’s not enabled, it will still calculate a percentage, but won’t associate a letter grade with it. Additionally, click the ‘More Options’ at the bottom of the ‘Course Details’ tab of the “Settings” menu for your course. Check the box for ‘Hide totals in student grades summaries.’ This means you’ll see the percentage total for your student (but no letter grade) and that your students won’t see the totals, only their results on the assignments.
2. Enable course grading scheme, but change the percentage ranges to be equally distributed across the 100-point scale. You can decide what makes sense for you, but an example would be: 0-20% = F; 20-40% = D; etc. Once you change the grading schema, the students will see the updated letter grade associated with the updated percentages. I choose to display grades to students as percentages or letter grades instead of points, but this isn’t necessary.
In terms of communicating this effectively to students, I have my grading scale in my FAQ page in Canvas (which I have for each course), and I’ve put it in the syllabus. I also make announcements and explain it in class, too. Students frequently double check when they start getting grades because it’s so unusual from what they normally see, but once they get it, it’s not a problem. The real issue that I’ve run into that I’m still trying to address arose when someone from an out-of-state institution contacted me to verify articulation/transfer for a student from my course. I’m happy to talk about this interaction more, if you like, but needless to say, there are a fair number of closed-minded colleagues at other institutions, and thus I’m rethinking whether this should actually be in my syllabus or not.
LikeLike
Pingback: Reconstructing Our Approach to Grades and Grading: Four Places to Begin – Composing Possibilities